Our handy Presentation Summary provides high-level analytics for your presentations. There are a few different ways you can access these analytics, which we've detailed below. But first, let's look at the sort of information you can glean from this page:
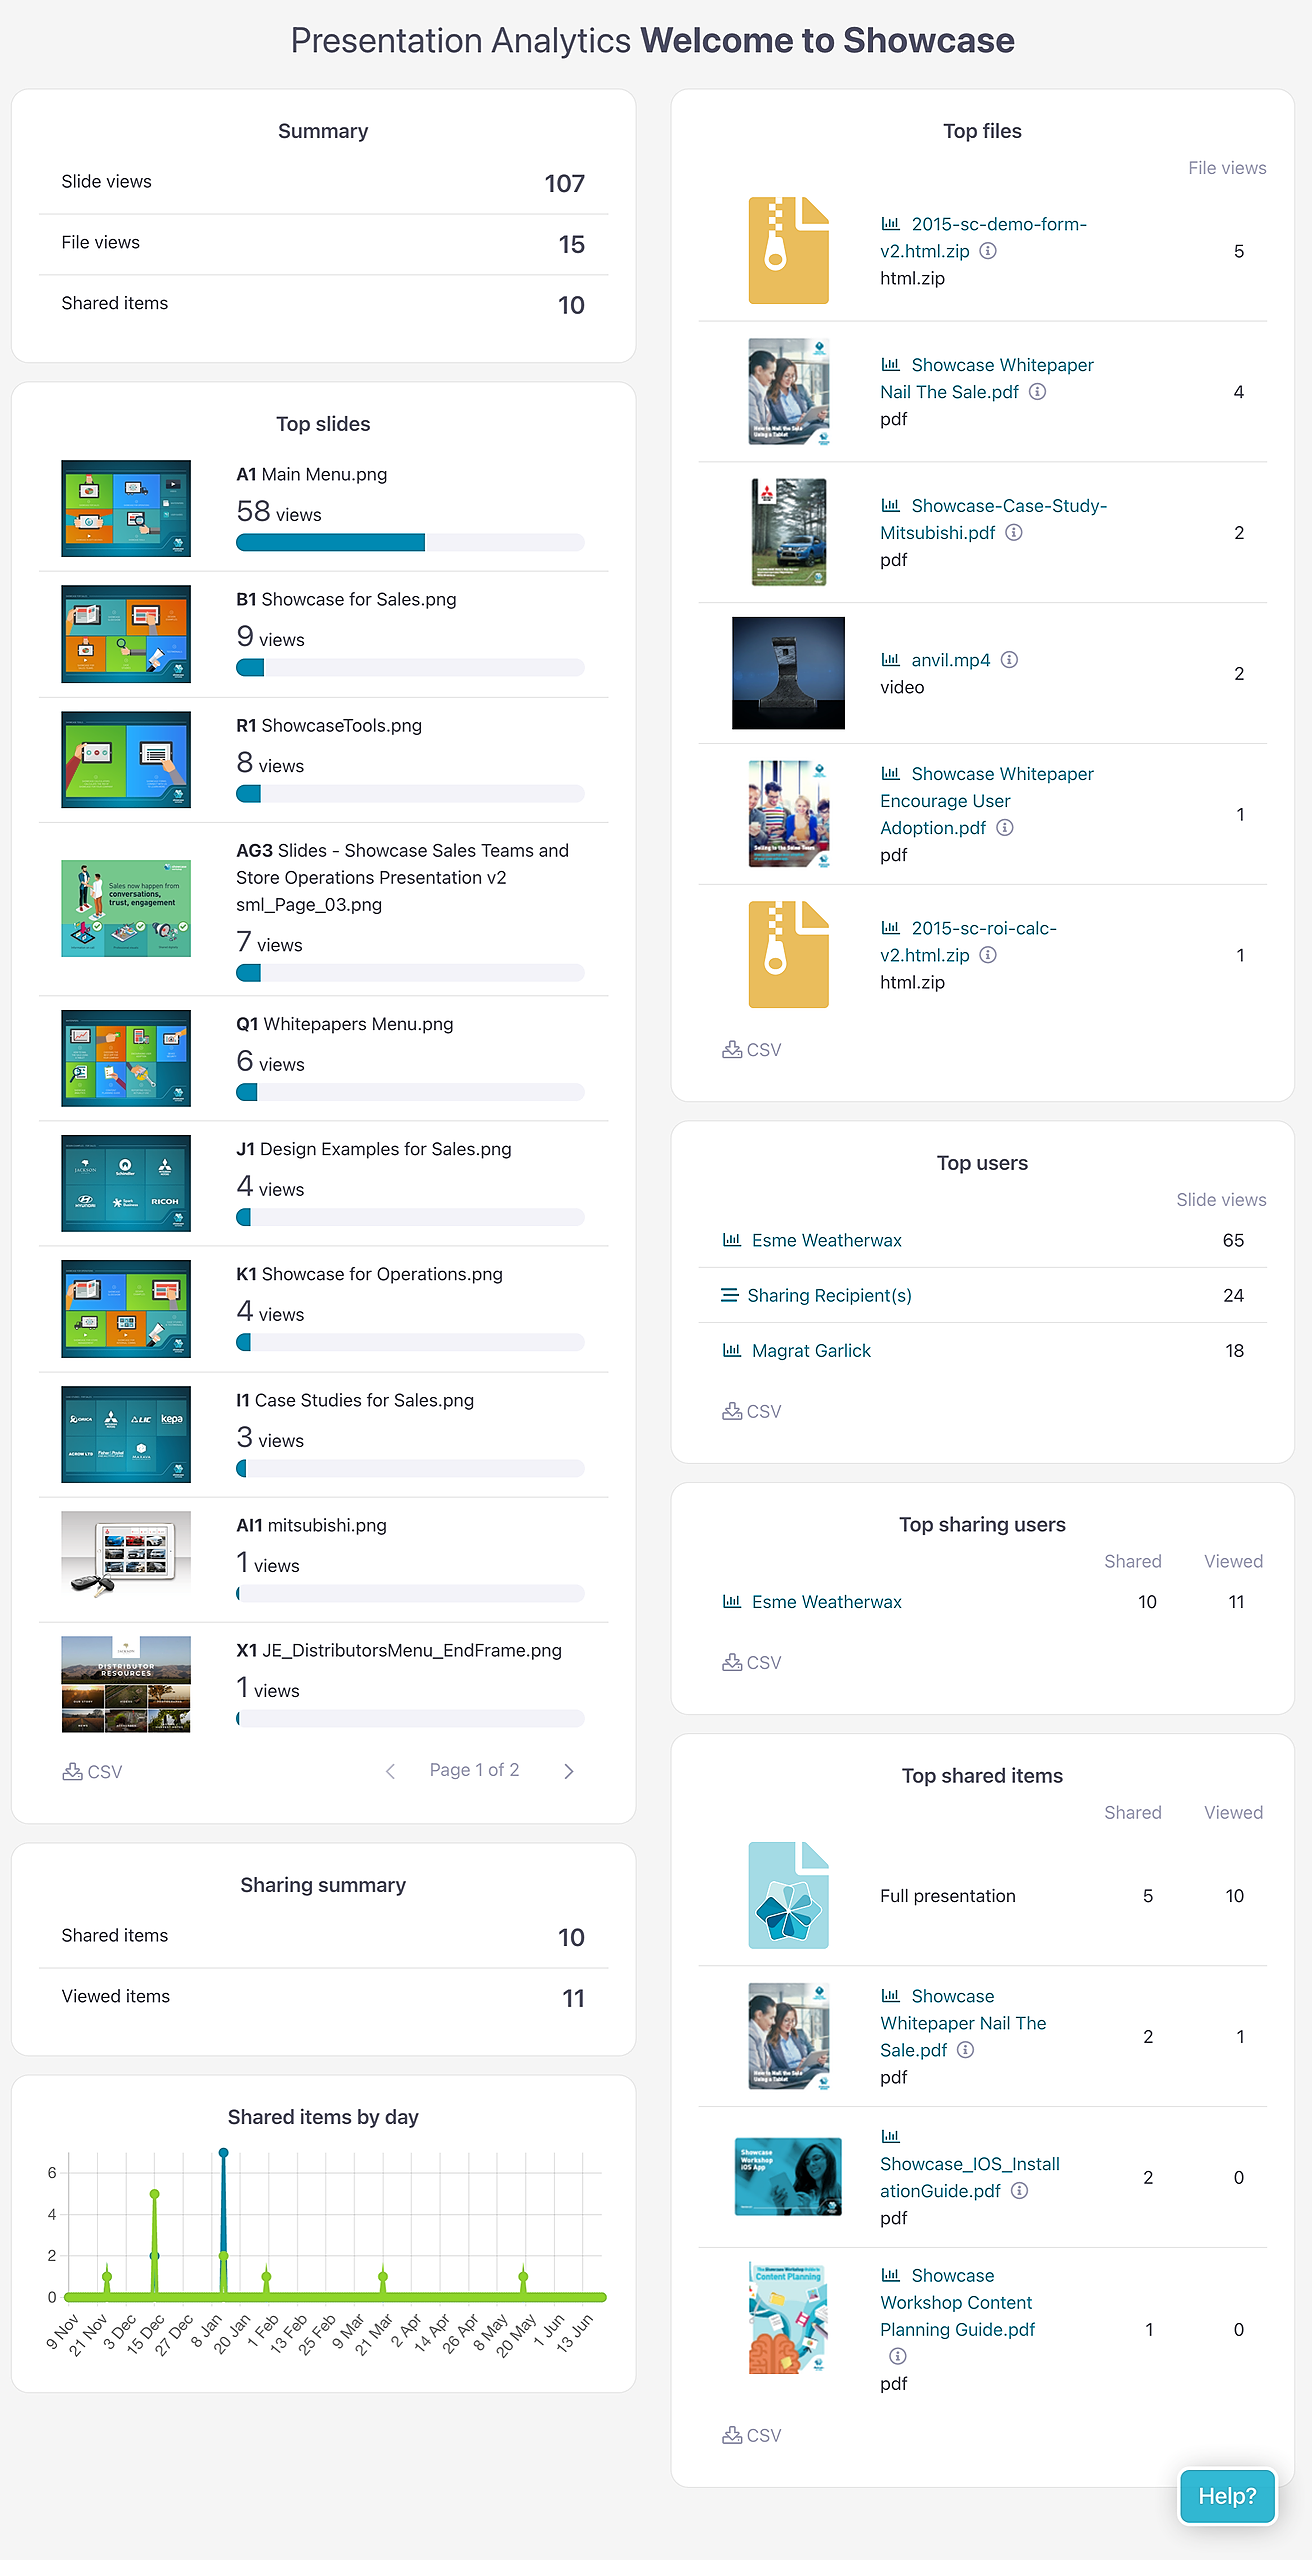
A summary of all slide views, file views, and shared items for that particular presentation.
A list of the most-viewed slides, with thumbnails.
A graph of how many slide views are occurring per day.
A list of most viewed files, with thumbnails.
A list of users with the most slide views.
A pie chart showing the breakdown of file types viewed.
A summary of how many presentations, slides, or files users have shared — including the user who shared them and the date.
A summary of how many of those shared items have actually been viewed.
Neat, huh!
There are three ways you can access analytics for an individual presentation:
Via the Reporting page
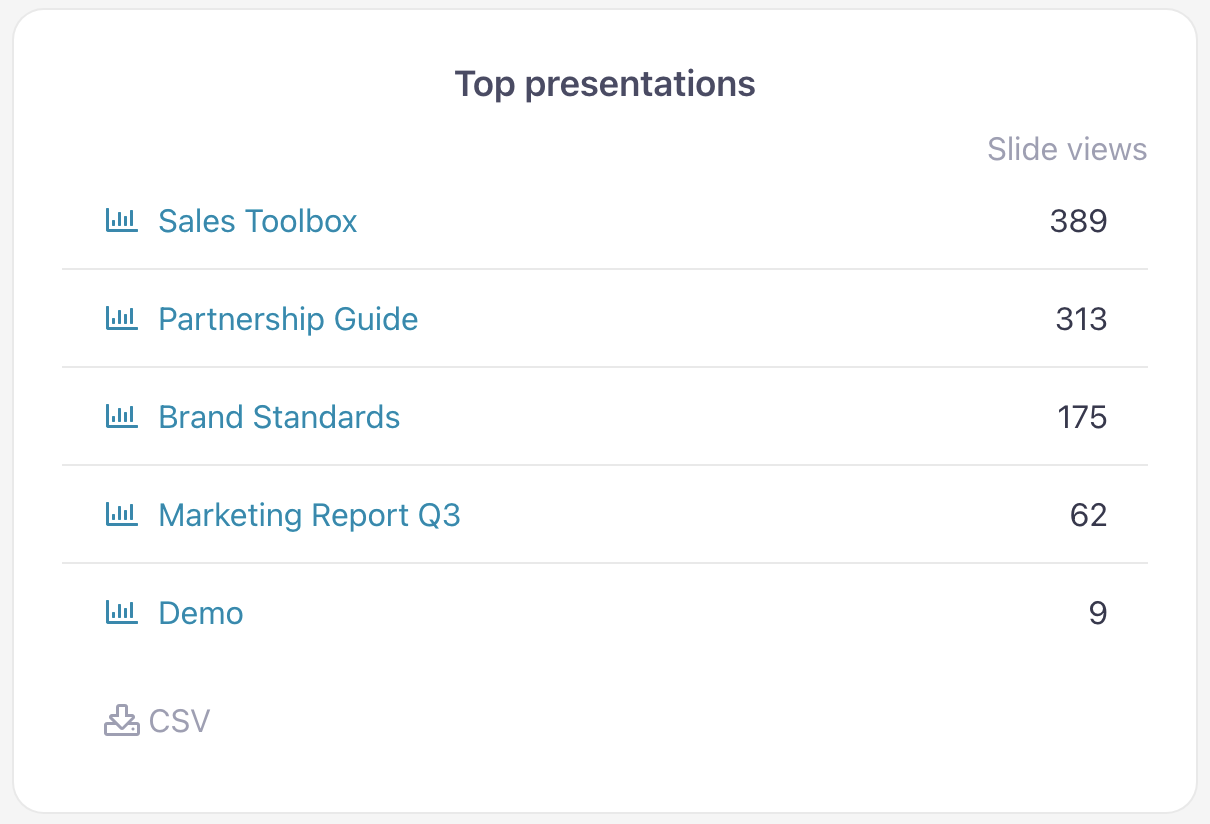
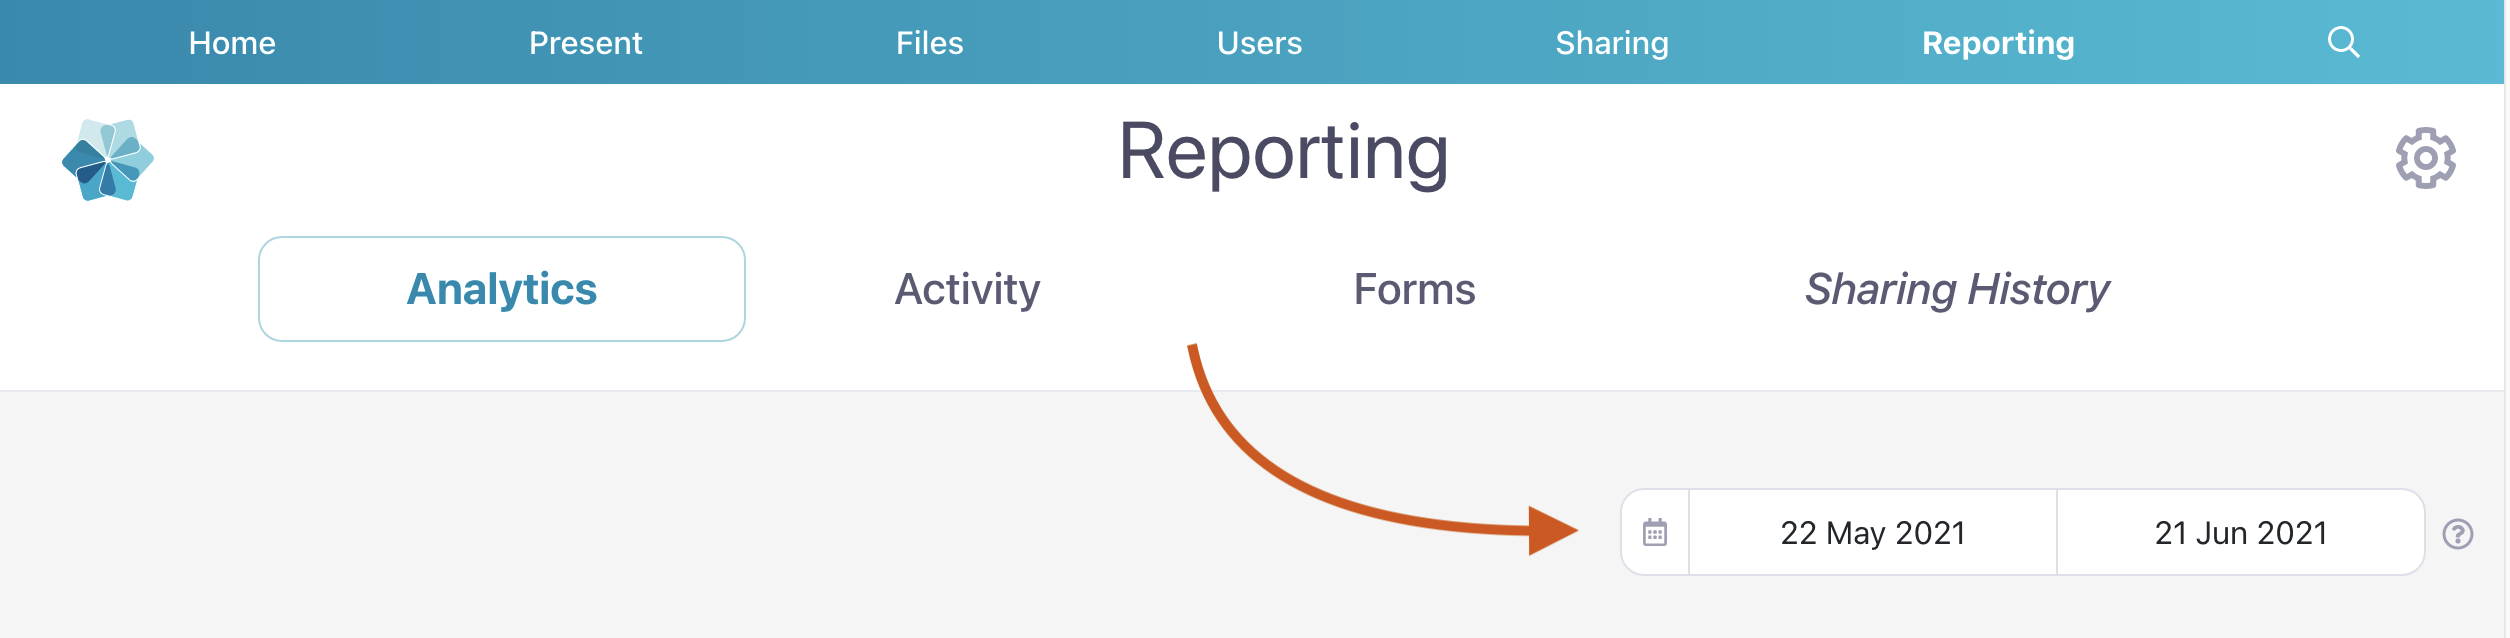
Open the 'Reporting' tab. 'Analytics' should be selected by default.

Choose the relevant presentation from the 'Top presentations' list.
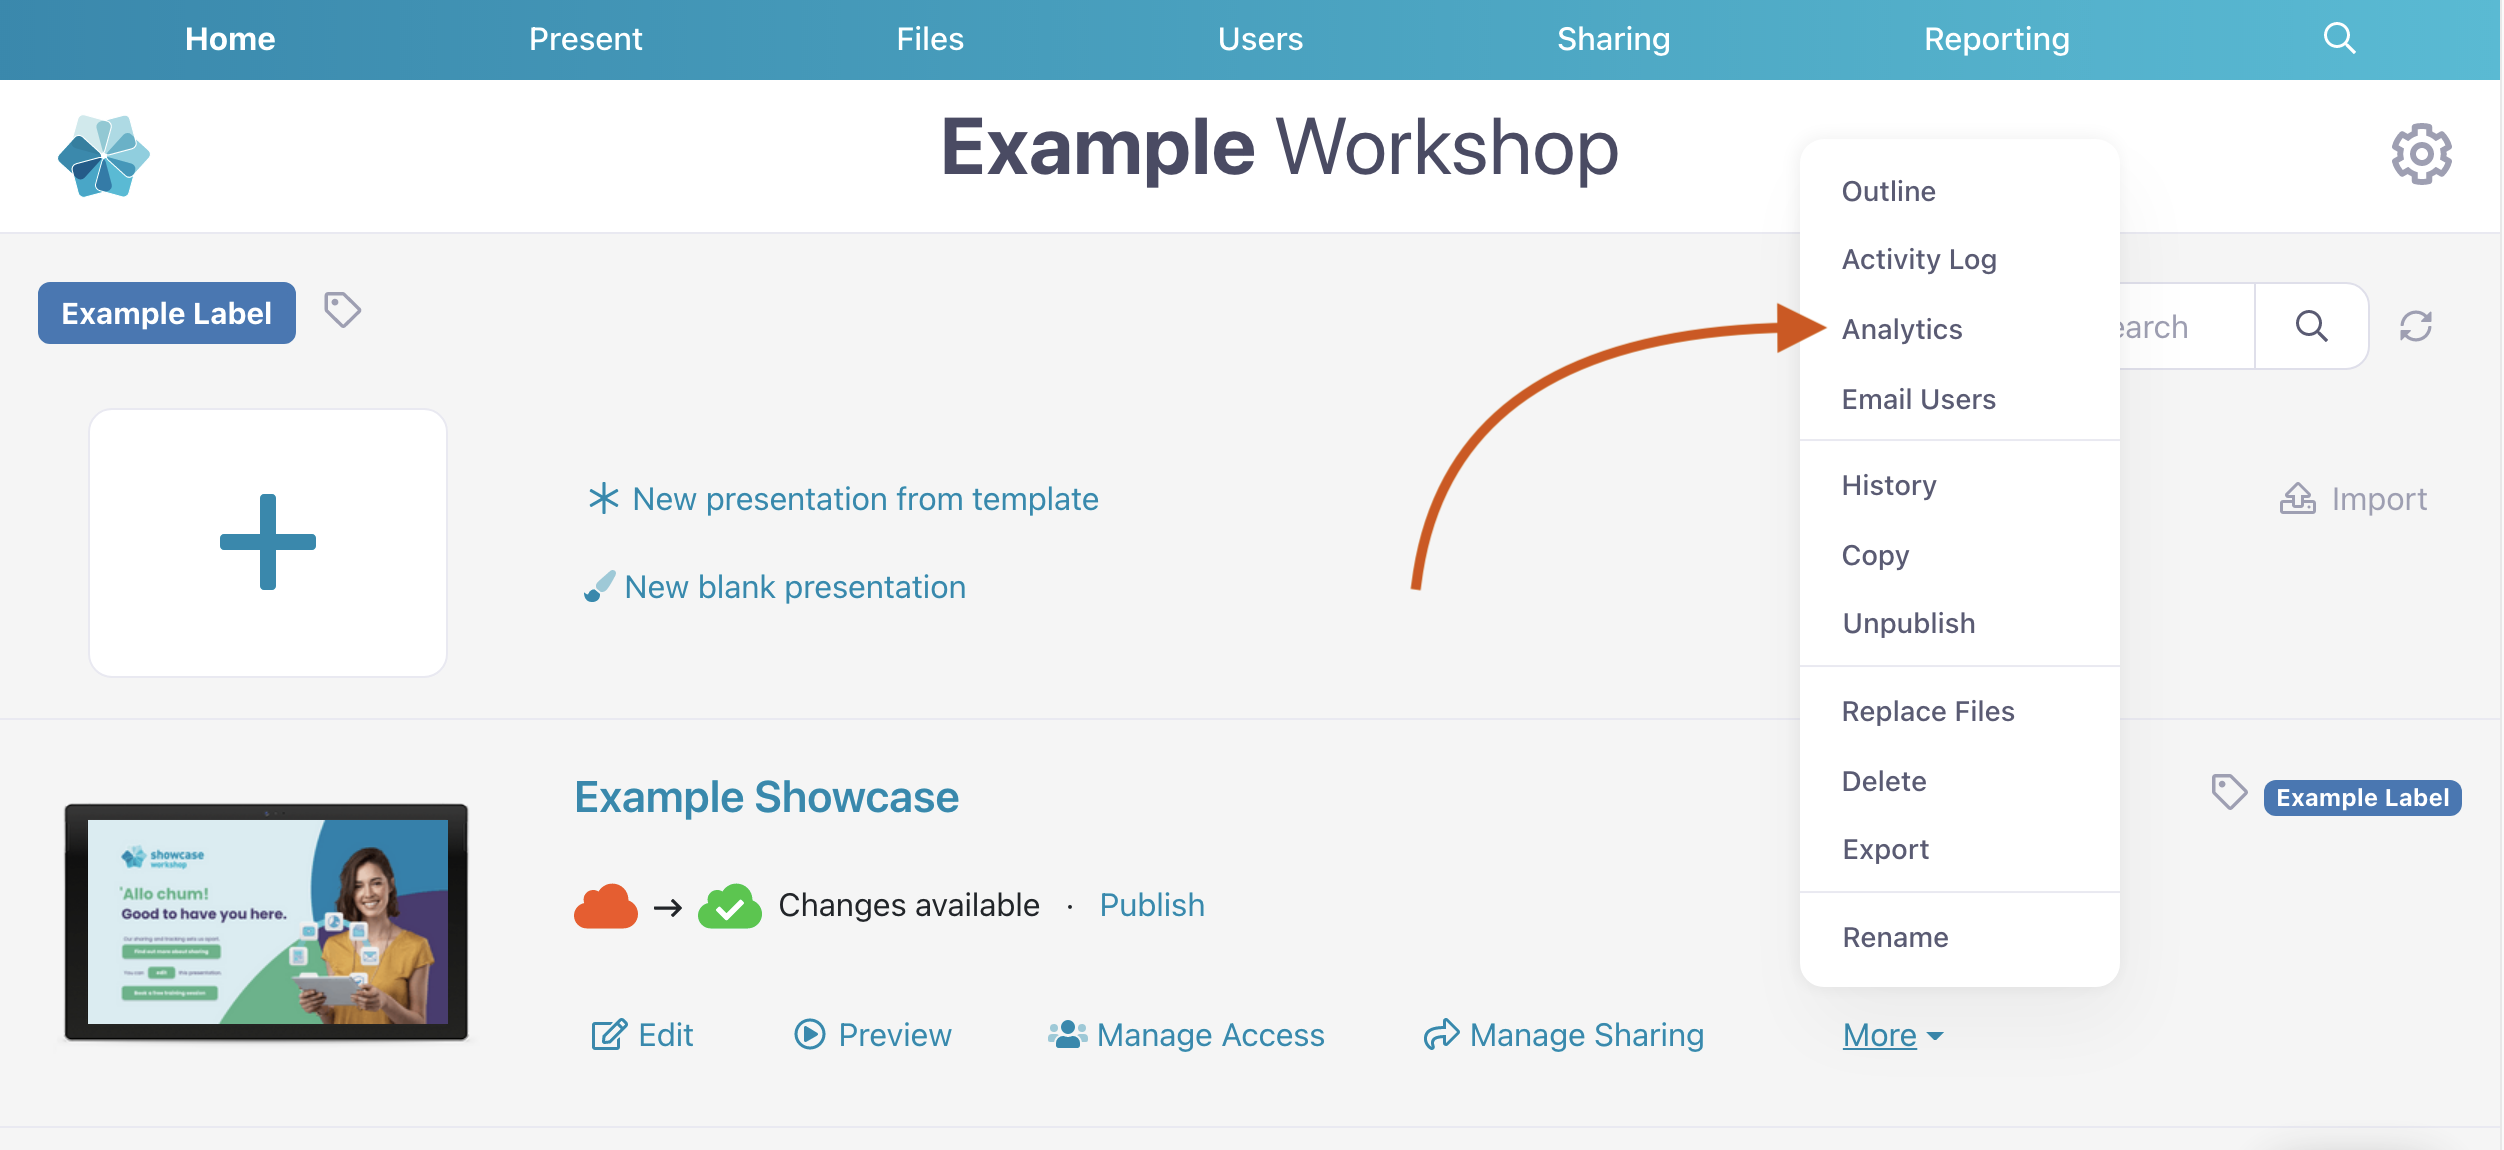
Via the Home page
From the Home page, navigate to the presentation you want to analyze and click 'More'.
Select 'Analytics' from the drop-down menu.
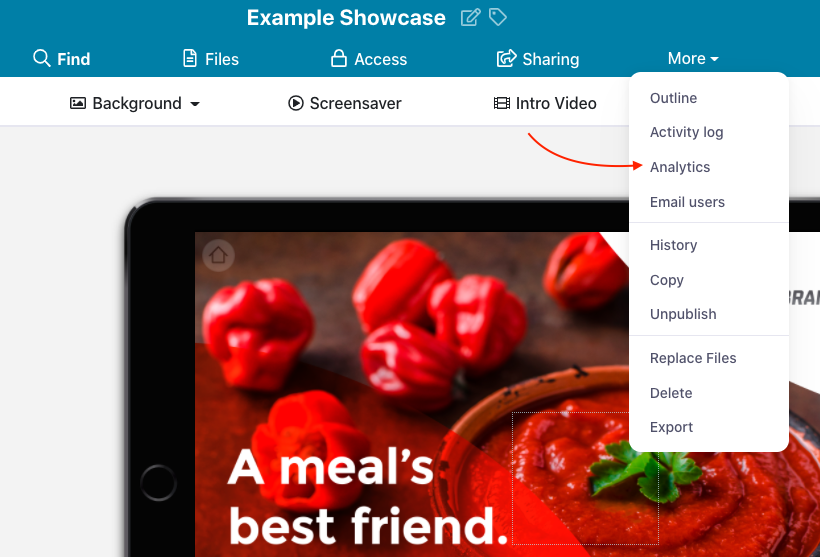
Via the Editor
Open the presentation in the Editor
In the toolbar at the top of the page, click 'More'
Select 'Analytics'.
And remember: You can change the date range you want to analyze at any time in the top right corner.
You can also see analytics by workshop, analytics by group, and analytics by user.