The Reporting page is a powerhouse of information about your workshop.
To access it:
Open the web app and click the 'Reporting' tab in the toolbar at the top of the screen.
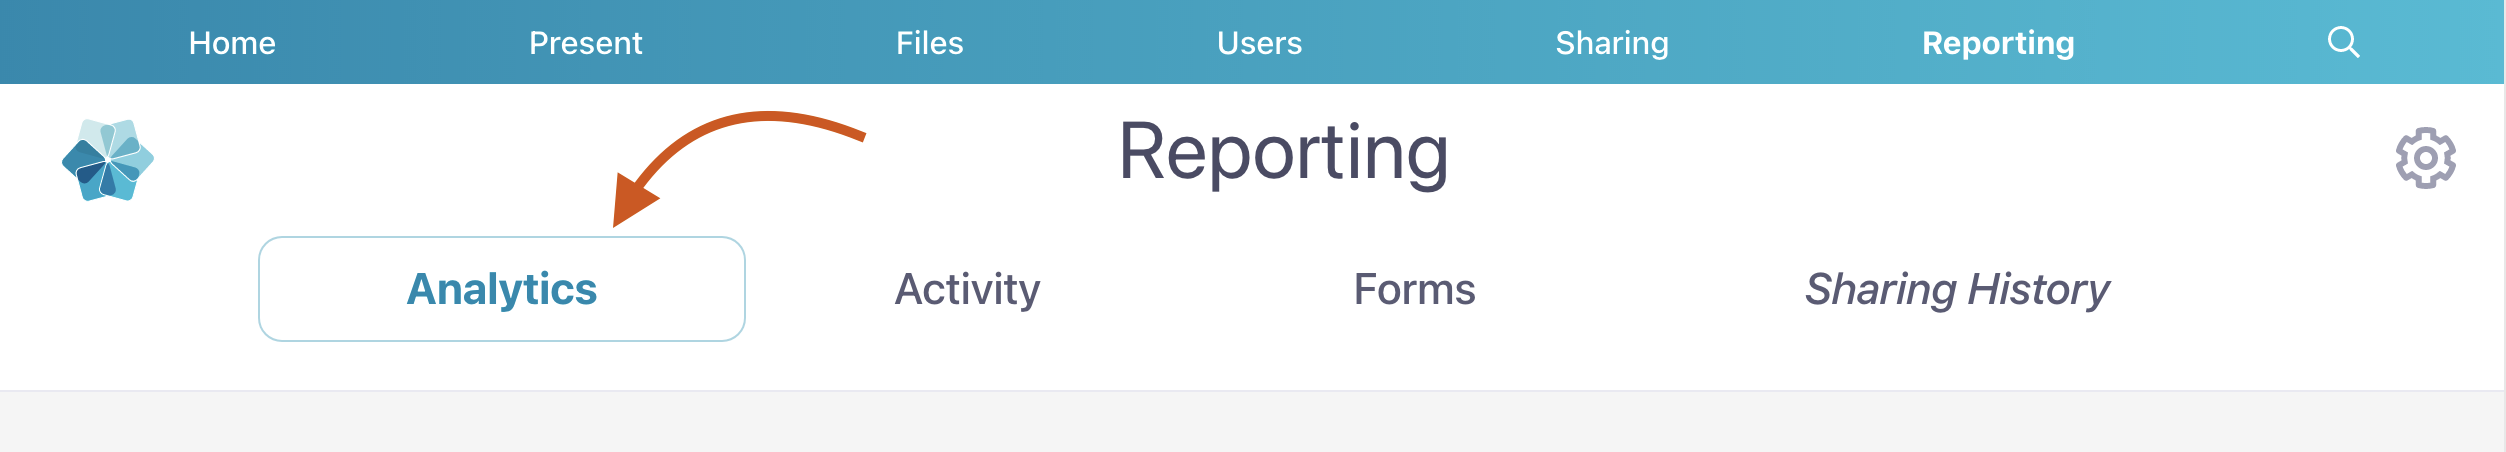
Select 'Analytics' (this is the default option but it's always good to double-check).
You should see your Workshop Summary directly below this, including:
A summary of all slide views, file views, and shared items across all presentations in the workshop.
A graph of how many slide views are occurring per day.
A list of the top presentations by slide views within this time period.
A list of the top users with the most slide views.
A list of the most commonly used devices used to access your workshop.
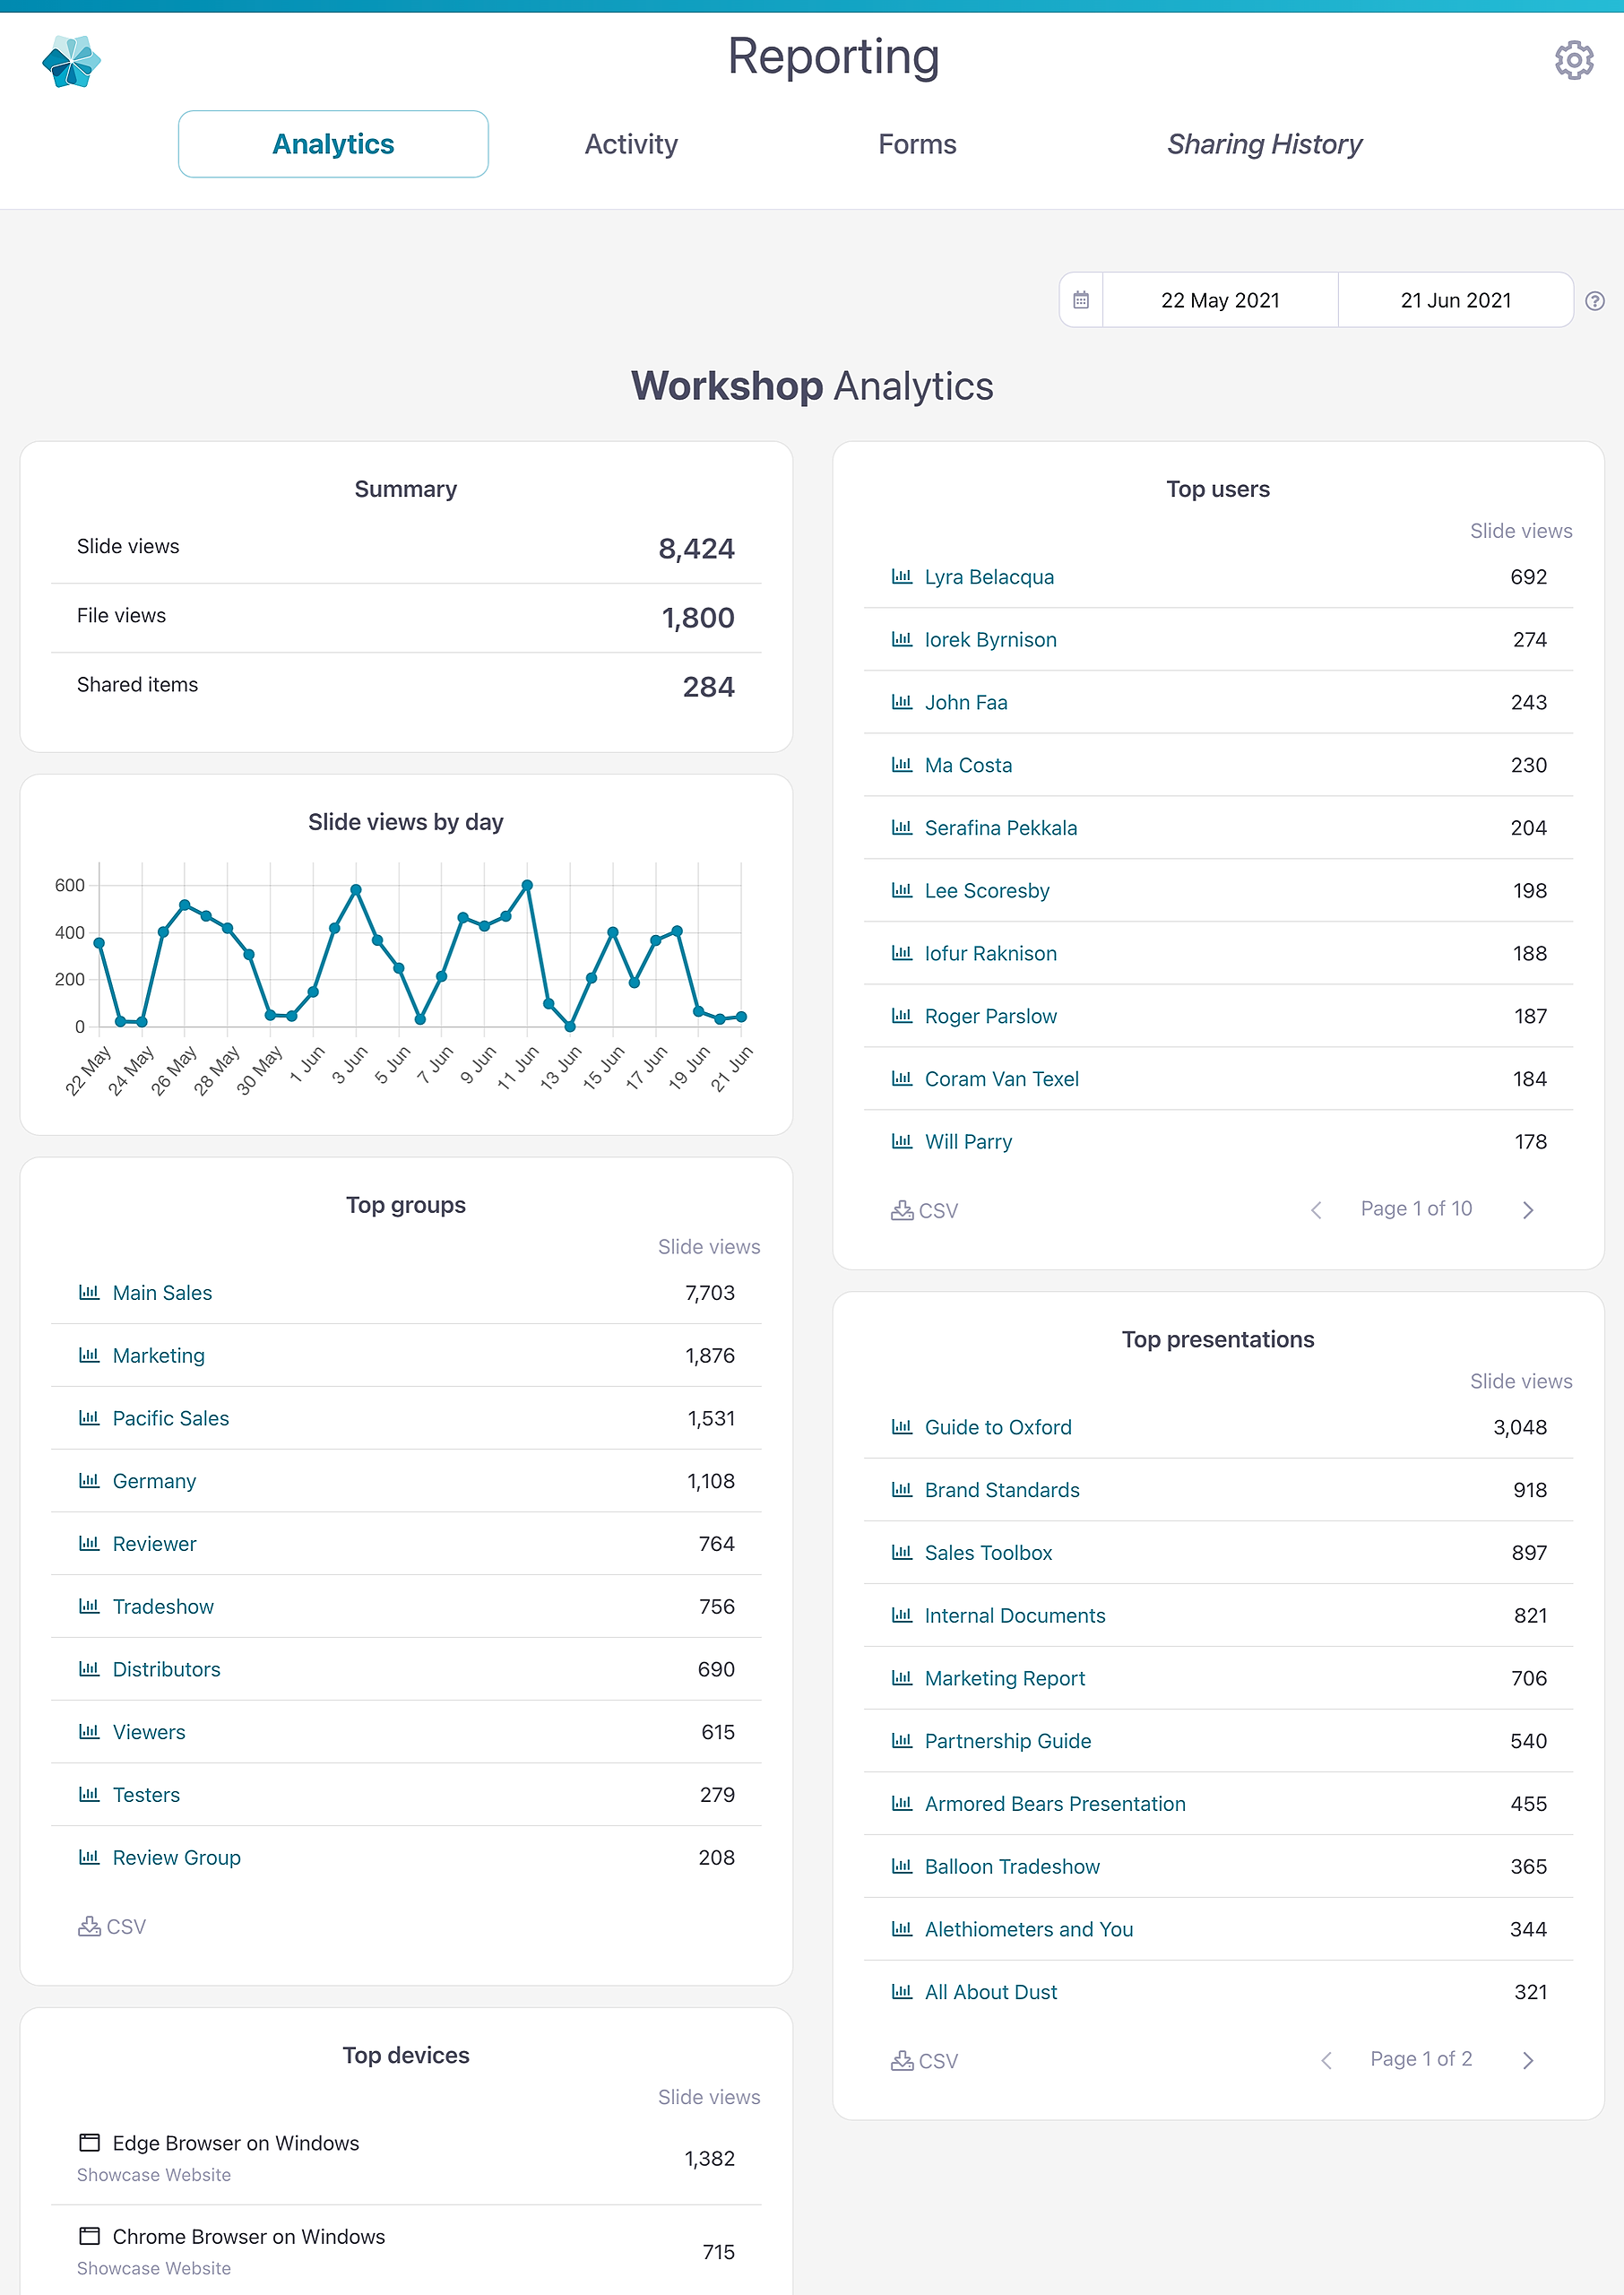
From here, you can drill down to see analytics by user, analytics by group, and analytics by presentation.
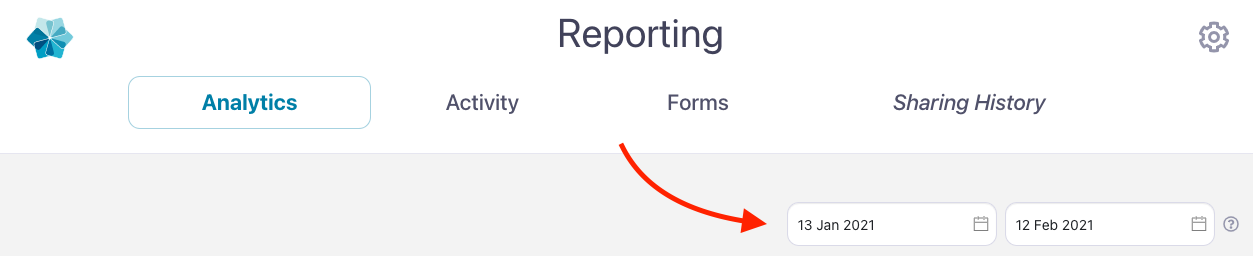
Top tip: You can change the date range you want to analyze at any time in the top right corner.
Note: This feature isn't available for Viewer users — but don't worry because you can still see your own sharing history!