
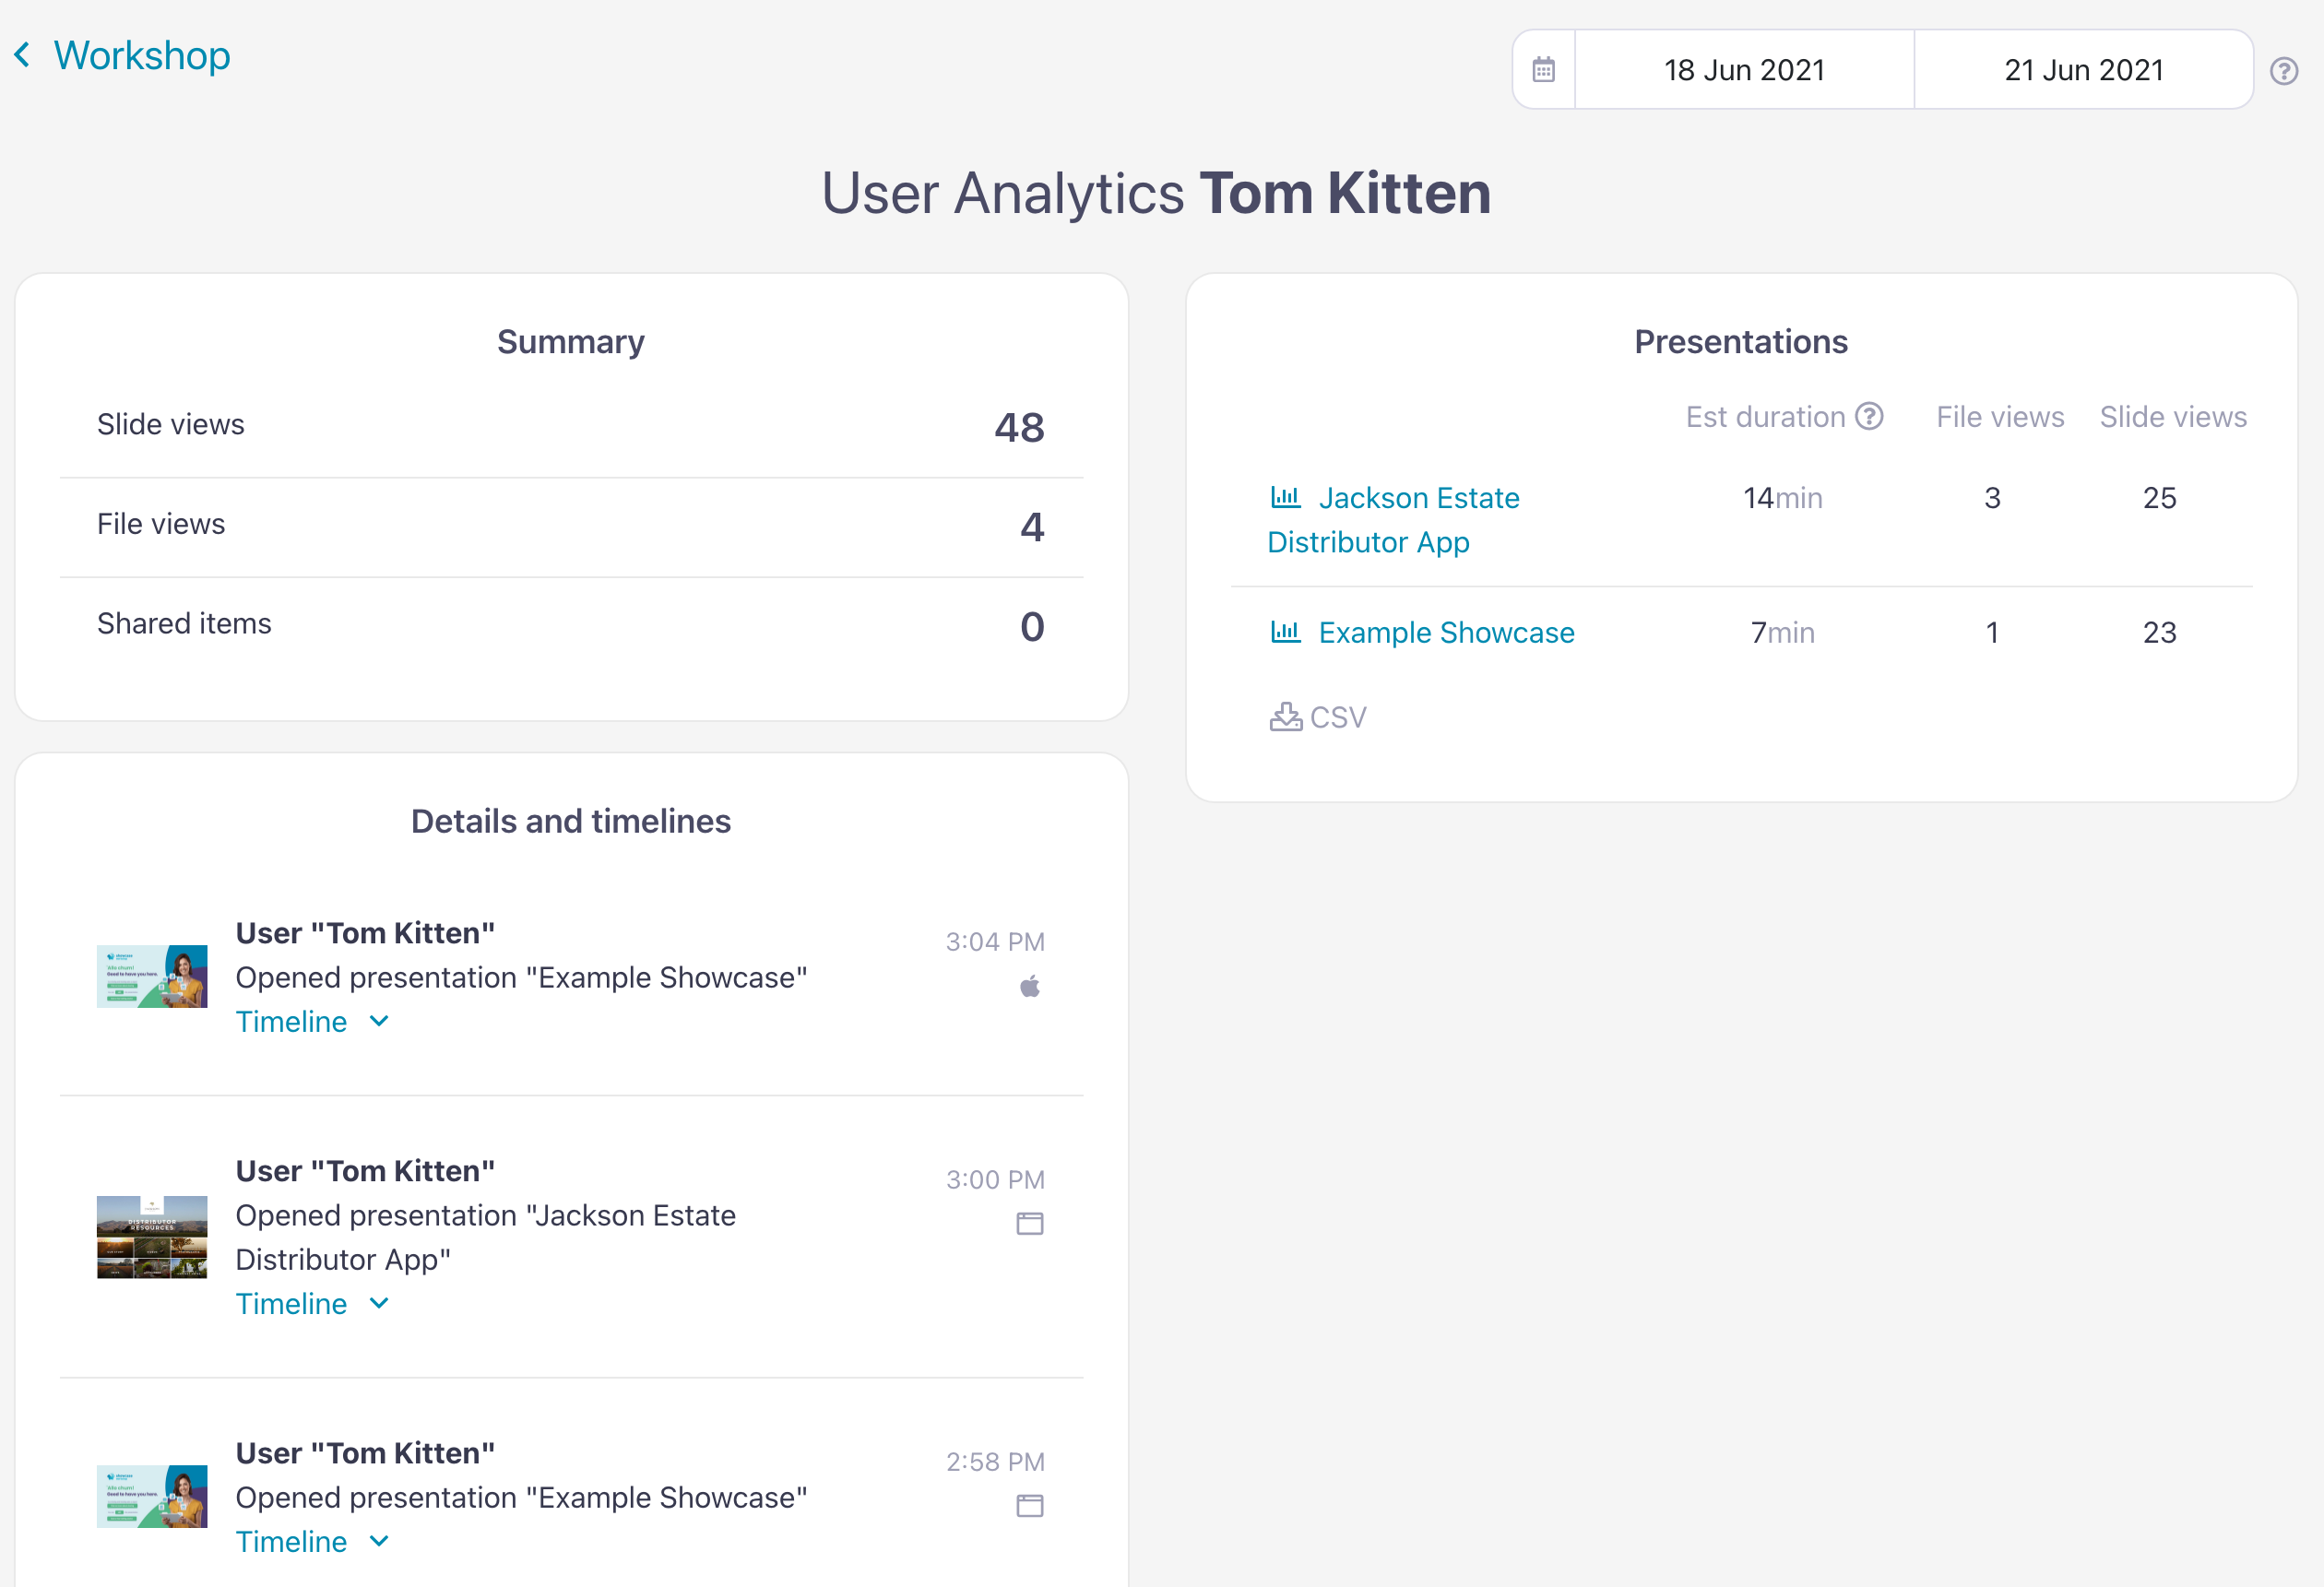
Our handy User Summary provides helpful reports on what your users have been viewing and sharing. There are a couple of different ways you can access these analytics, which we've detailed below. But first, let's look at the sort of information you can glean from this page:
- A summary of how many slides and files the user has viewed.
- A summary of what they've shared across all presentations in the workshop.
- A graph of how many times the user has viewed slides per day
- A detailed record of each time they have viewed a presentation — if you click 'Timeline' you'll see which slides and files they viewed, in which order, for how long.
- A list of the presentations the user views most, ordered by the amount of time spent viewing.
You can even go a step further and view user analytics by presentation! This means you can see how a specific user has interacted with a specific presentation. To do this, open the User Summary page and select the presentation from the 'Presentations' section.
Incredible!
There are two ways you can access analytics for individual users:
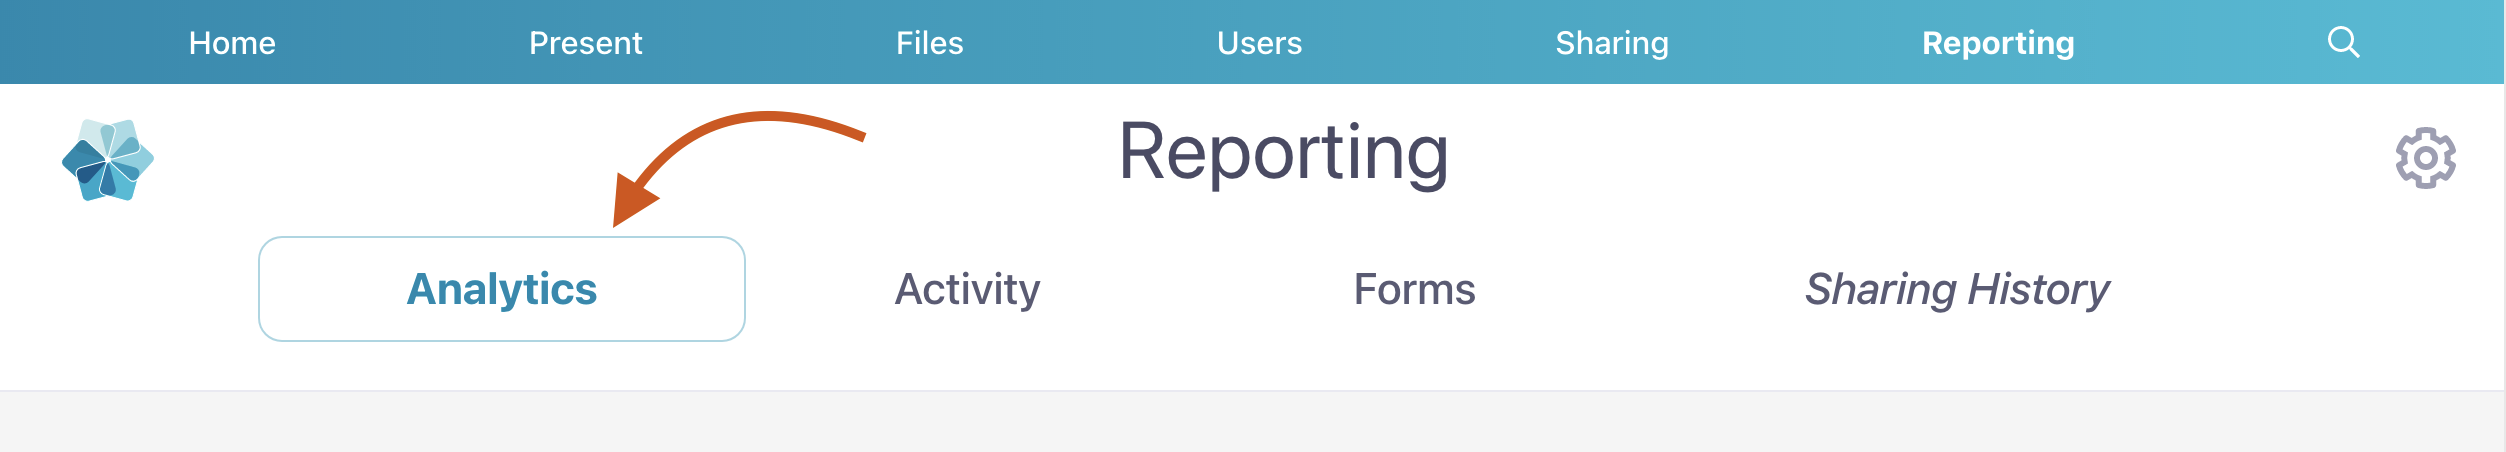
Via the Reporting tab
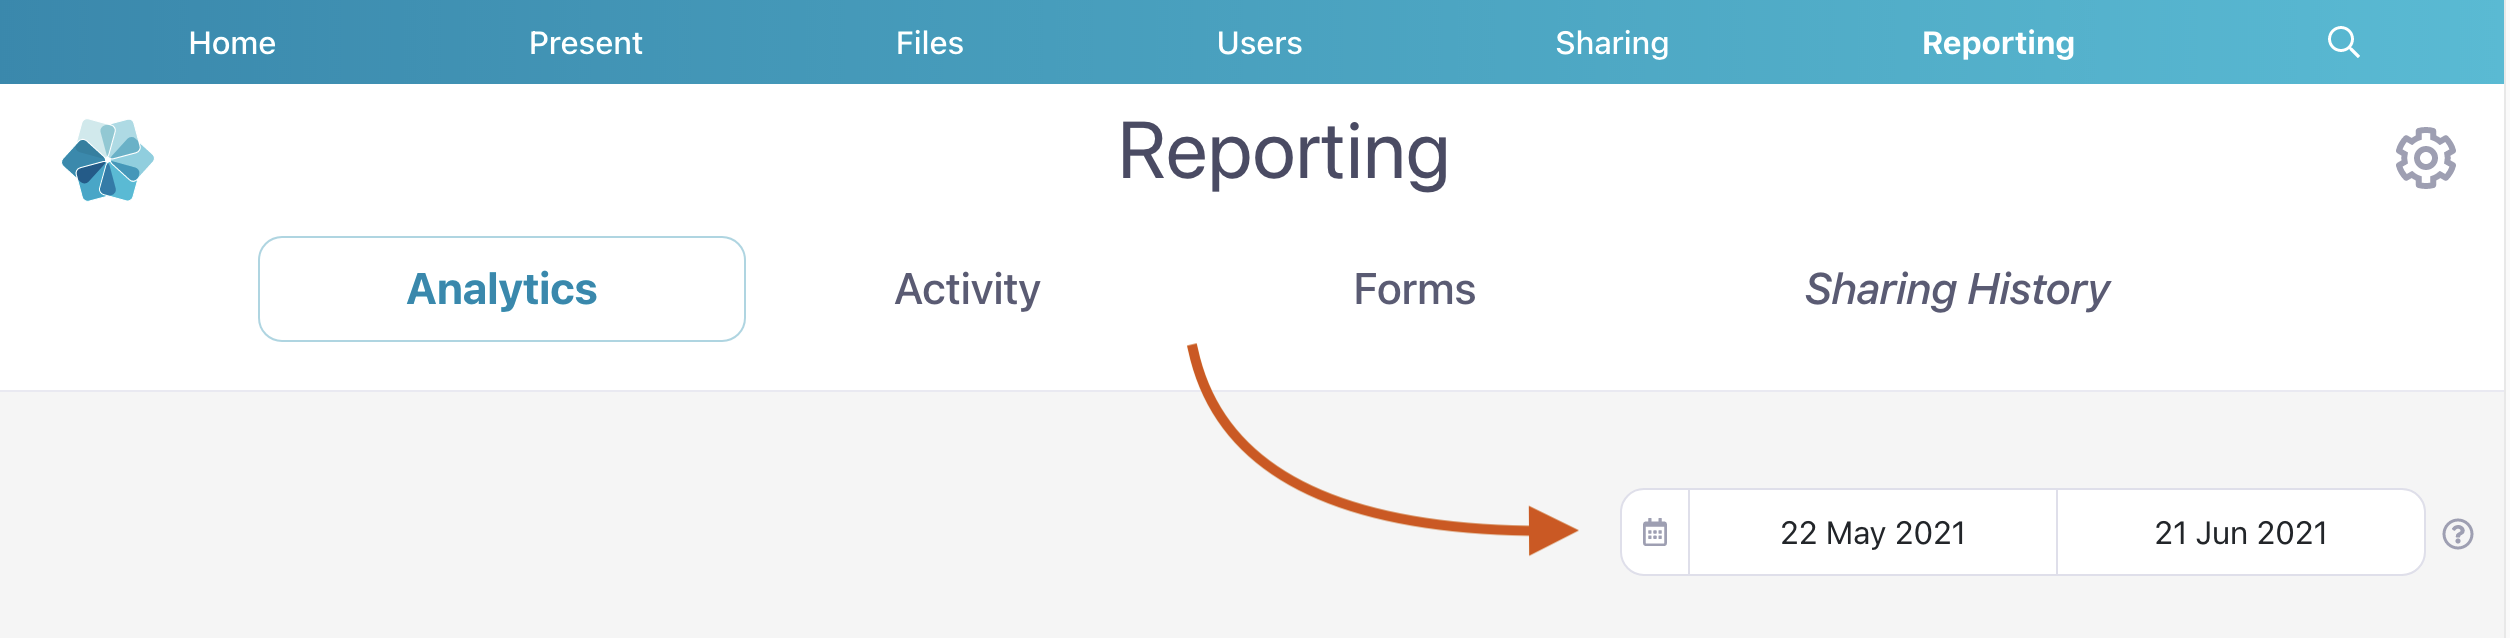
- In the web app, click 'Reporting' in the toolbar at the top of the page
- Select 'Analytics' (this is the default option but it's always good to double-check)
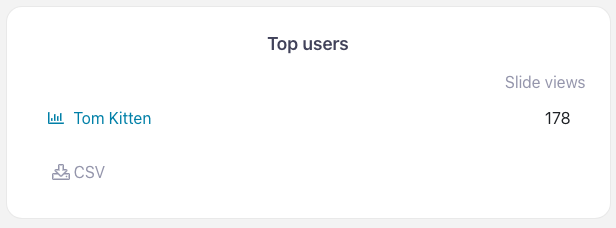
- Scroll down the page until you get to 'Top Users' and click the name of the user you want data for.
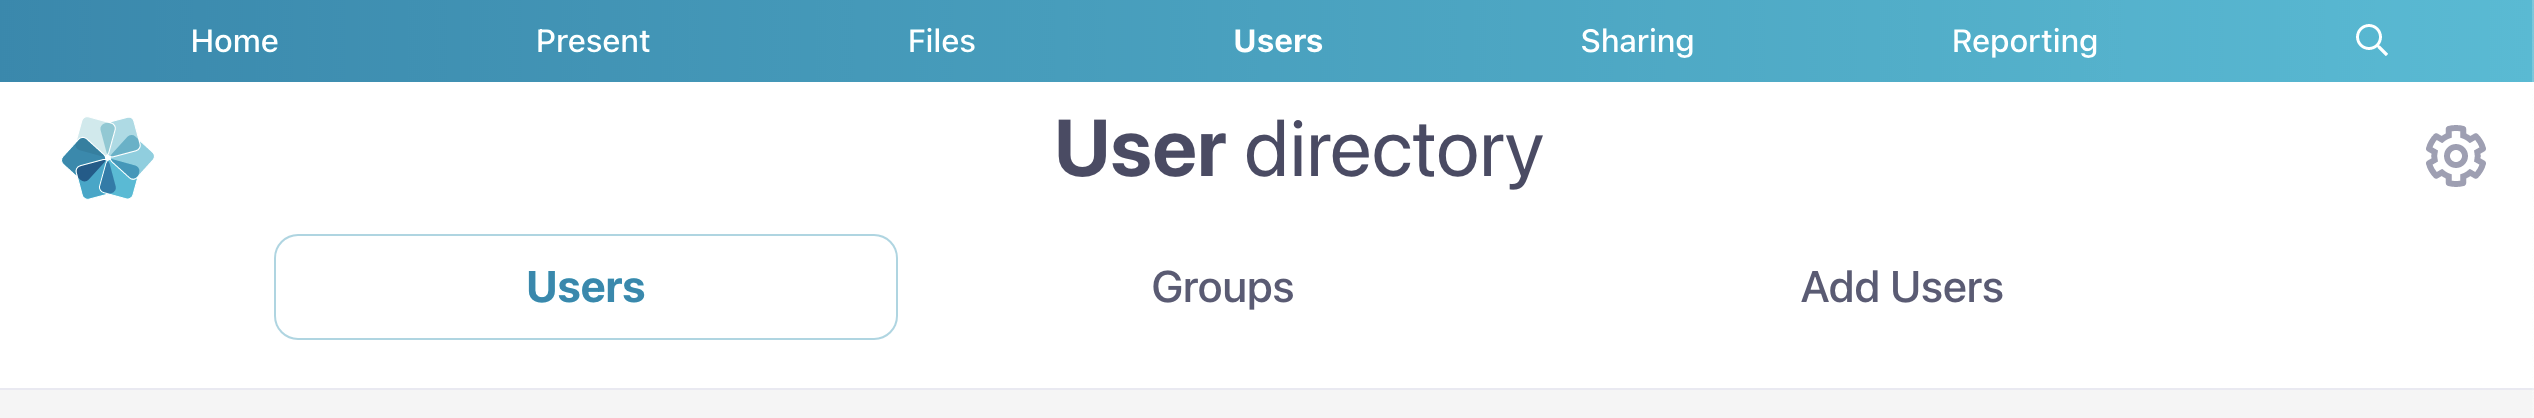
Via the Users tab
- In the web app, click 'Users' in the toolbar at the top of the page.
- Select a user from the list by clicking on their name.
- This will open their User Details page. Click 'User Analytics' to open their User Summary.

Remember: You can change the date range you want to analyze at any time in the top right corner.
Note: This feature is not available for Viewer users — but don't worry because you can still see your own sharing history!